Tracing Temporal Workflow with DataDog
This post describes how we can provide a Temporal workflow with the tracing aspect. DataDog tracing service will be used as an example. To better understand what Temporal is and how it can be used for microservices, you can read:
Temporal Context Propagators post
Temporal Universal Starters post
What is tracing?
Microservice architecture has many advantages:
- scalability
- robustness
- performance
- maintainability
- extensibility
- reusability
But there also are some disadvantages in a microservice architecture:
- system status and monitoring
- complicated infrastructure
- deployment orchestration
- workflow orchestration
- code reusability
Temporal provides a solution for workflow orchestration and helps provide a better infrastructure and system status and monitoring. This is because we have it as the transport and solve the discovery, balancing, retries and backpressure aspects. At the same time, Temporal allows for watching the workflow status and activities status using its API and TemporalUI.
But we can make the monitoring and the understanding of what happens during a workflow execution even better if we use tracing.
Tracing is a way to make a flame graph for a microservice system execution, in which every line will be a tracing span for an arbitrary service activity. Any span can have parent and children spans. All the spans for a process are included in the single trace.
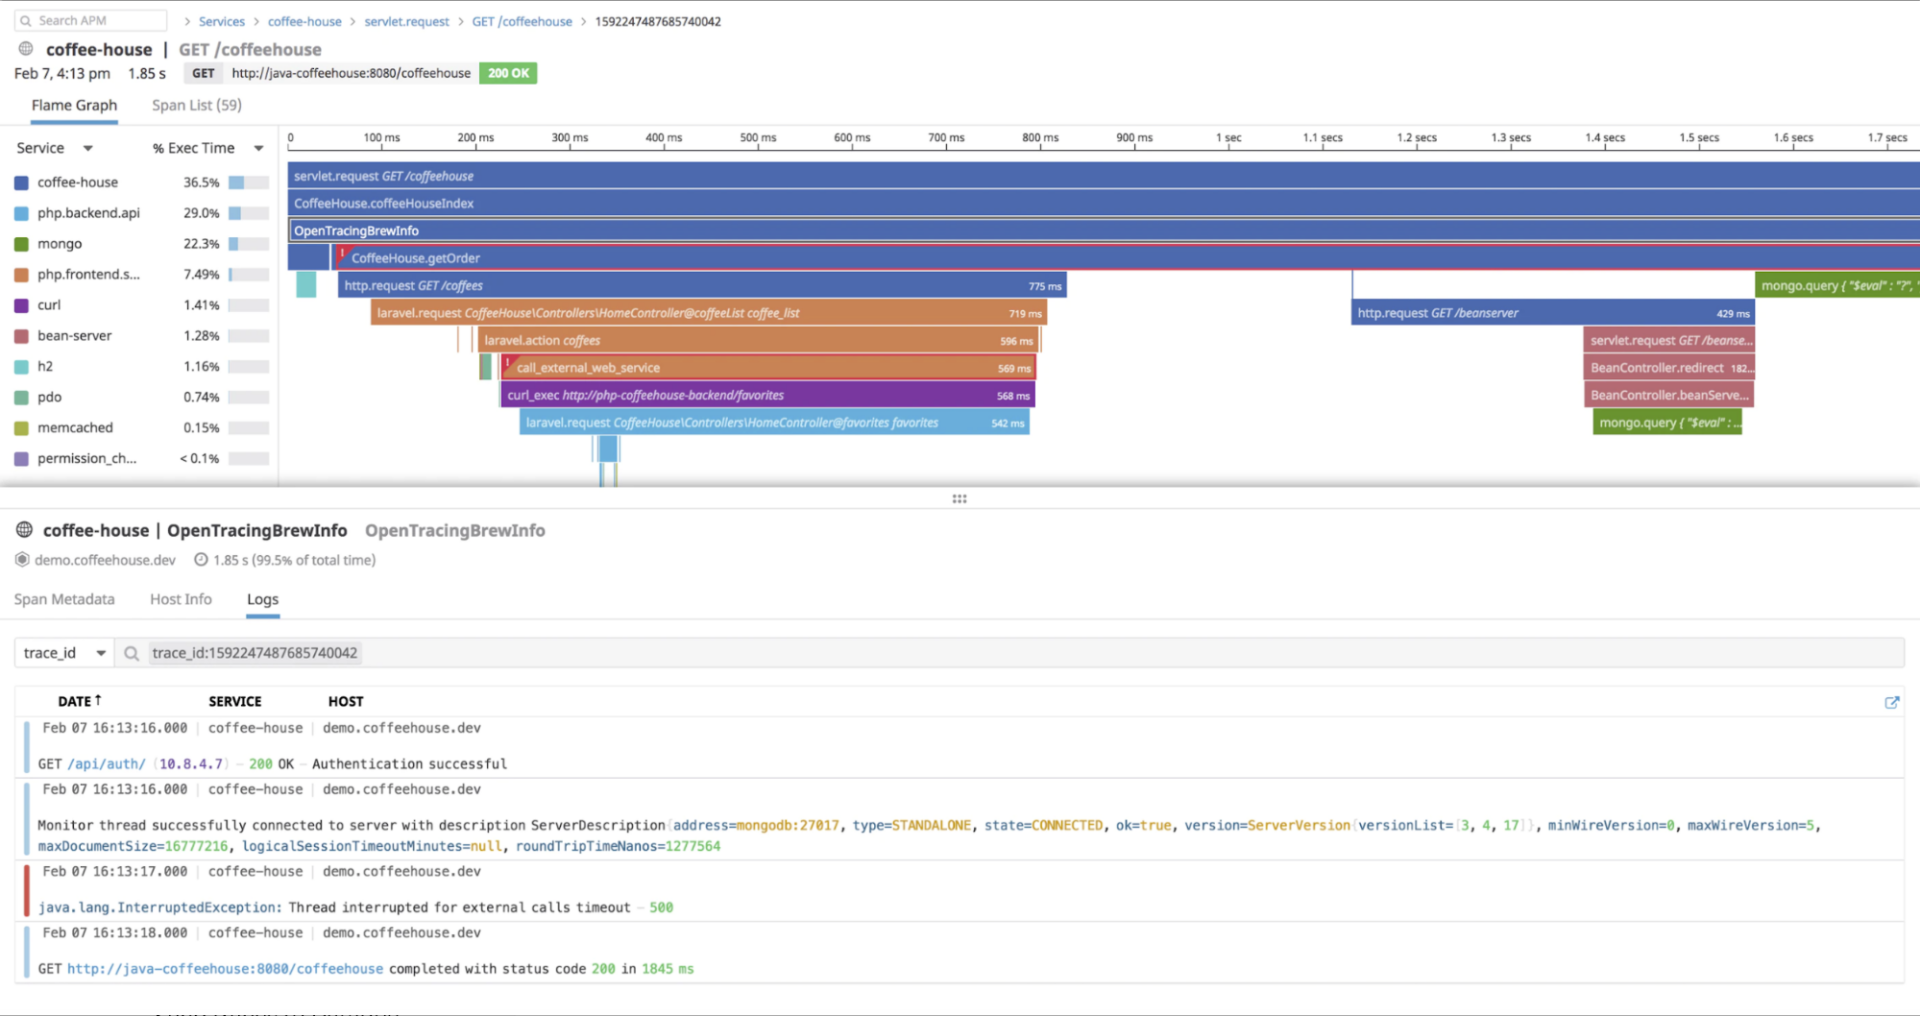
Every span has some tags: the name of the function, the service name, version, etc. It also contains the start and the end time.
With this tracing, we can:
- visually understand and explore what happens during workflow execution
- see when different services take part as they are present with different colors
- see some regularities and find the longest or most frequent parts for further optimization
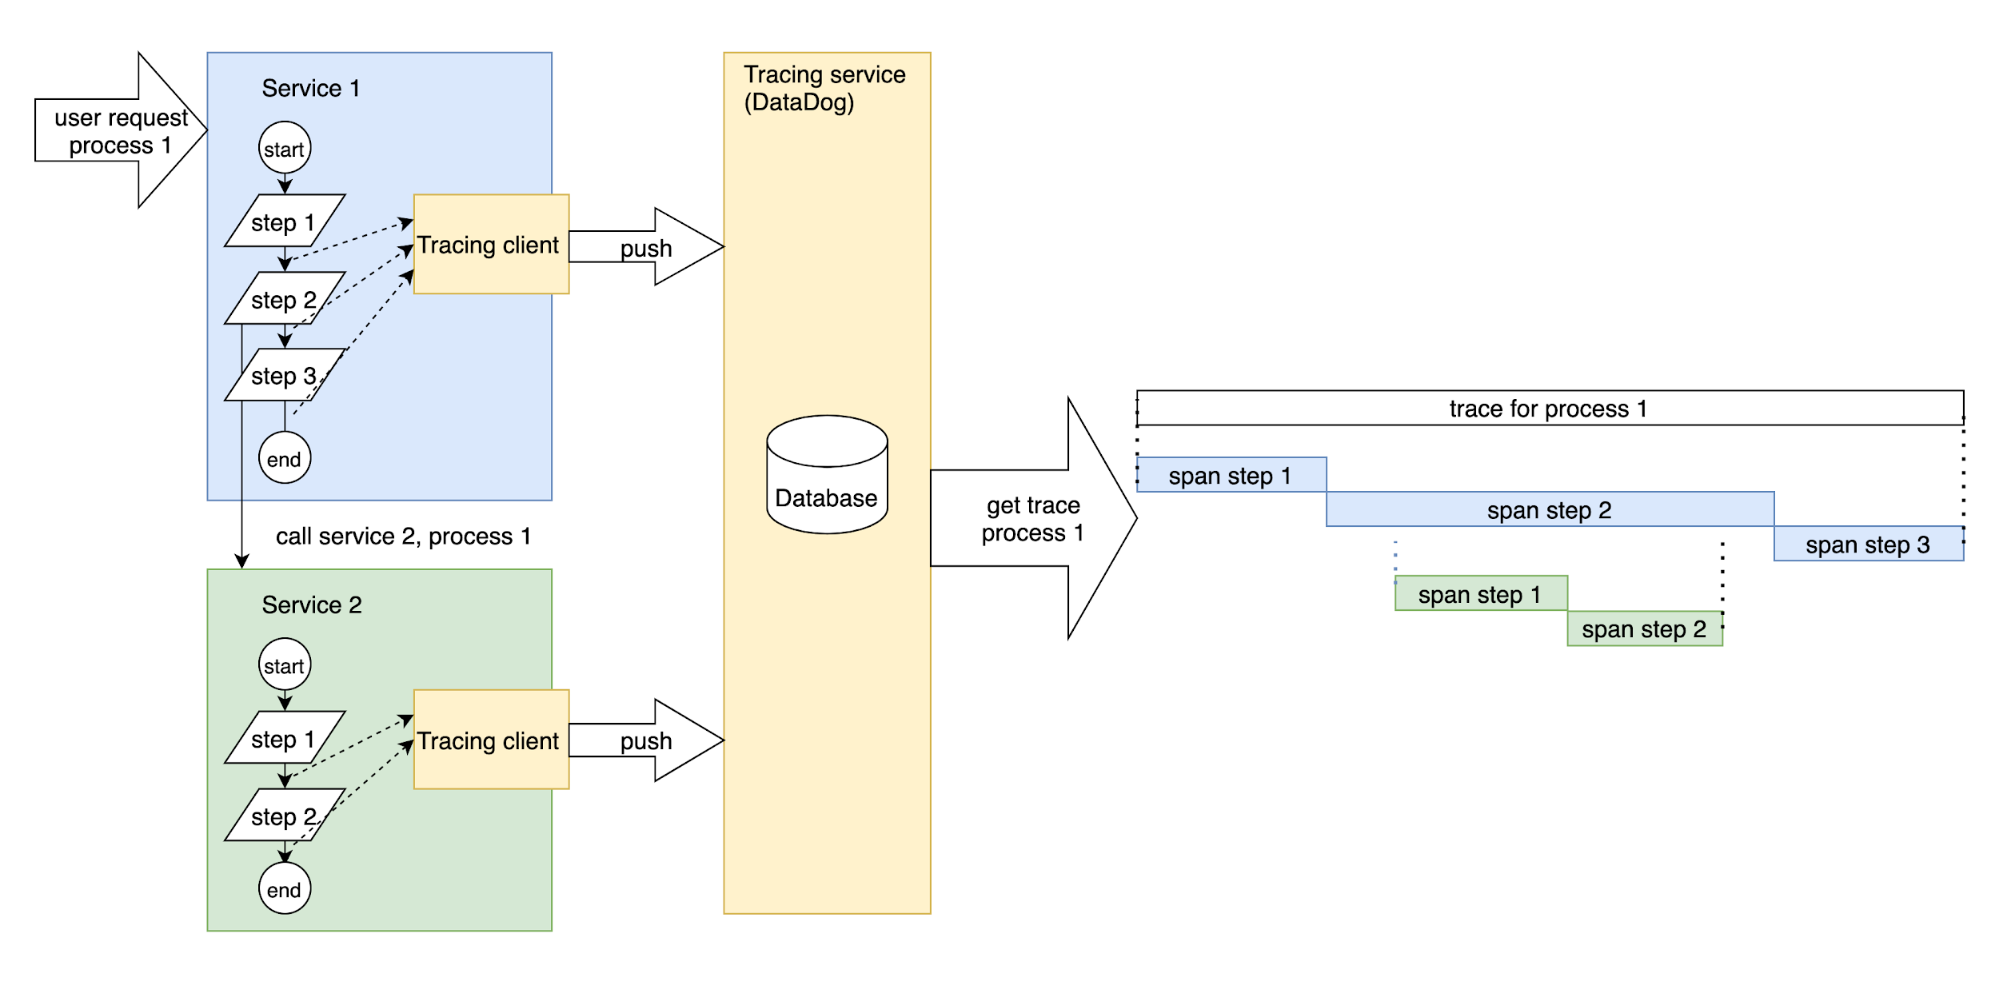
How does it work? The tracing runs as a separate service. The client is used in the services for starting a span or finishing the span. When the span is finished, the client pushes the information to the tracing service that has its storage for the spans and traces. So finally, we have all the information for the visual tracing representation: the spans with the parent/child relations.
Why DataDog?
In fact, Temporal itself can build traces and the traces can be found at the TemporalUI:
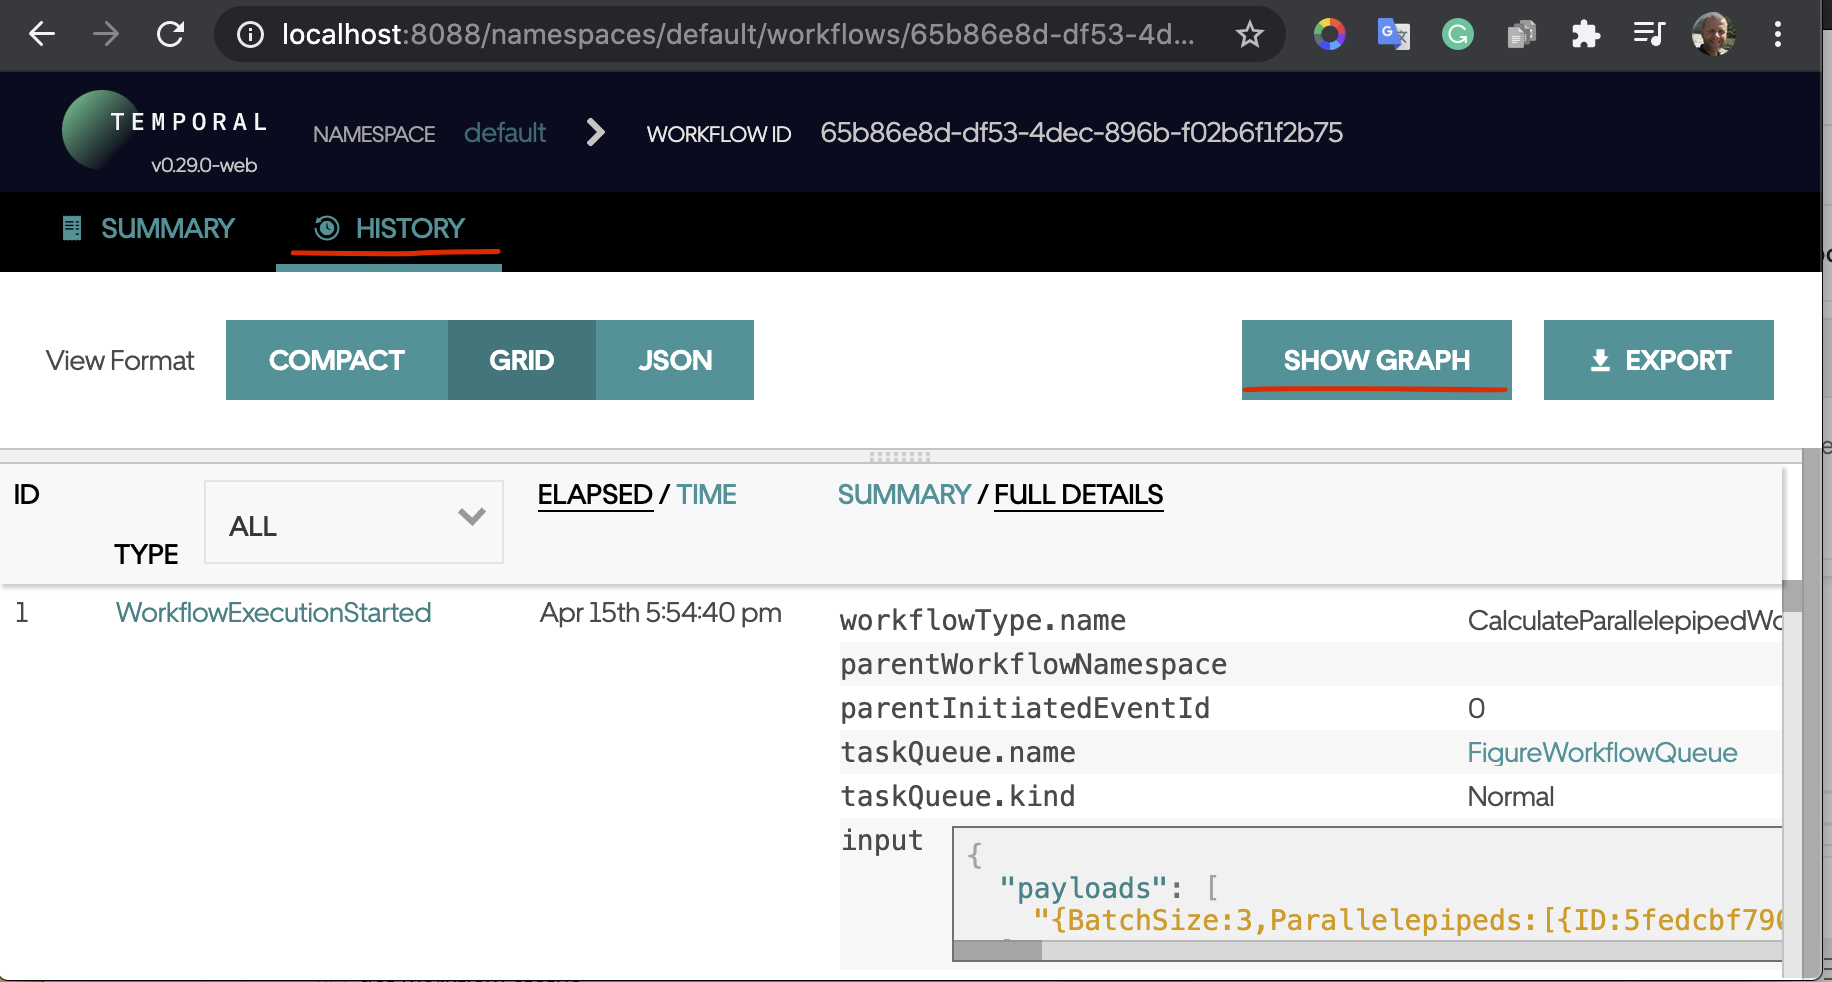
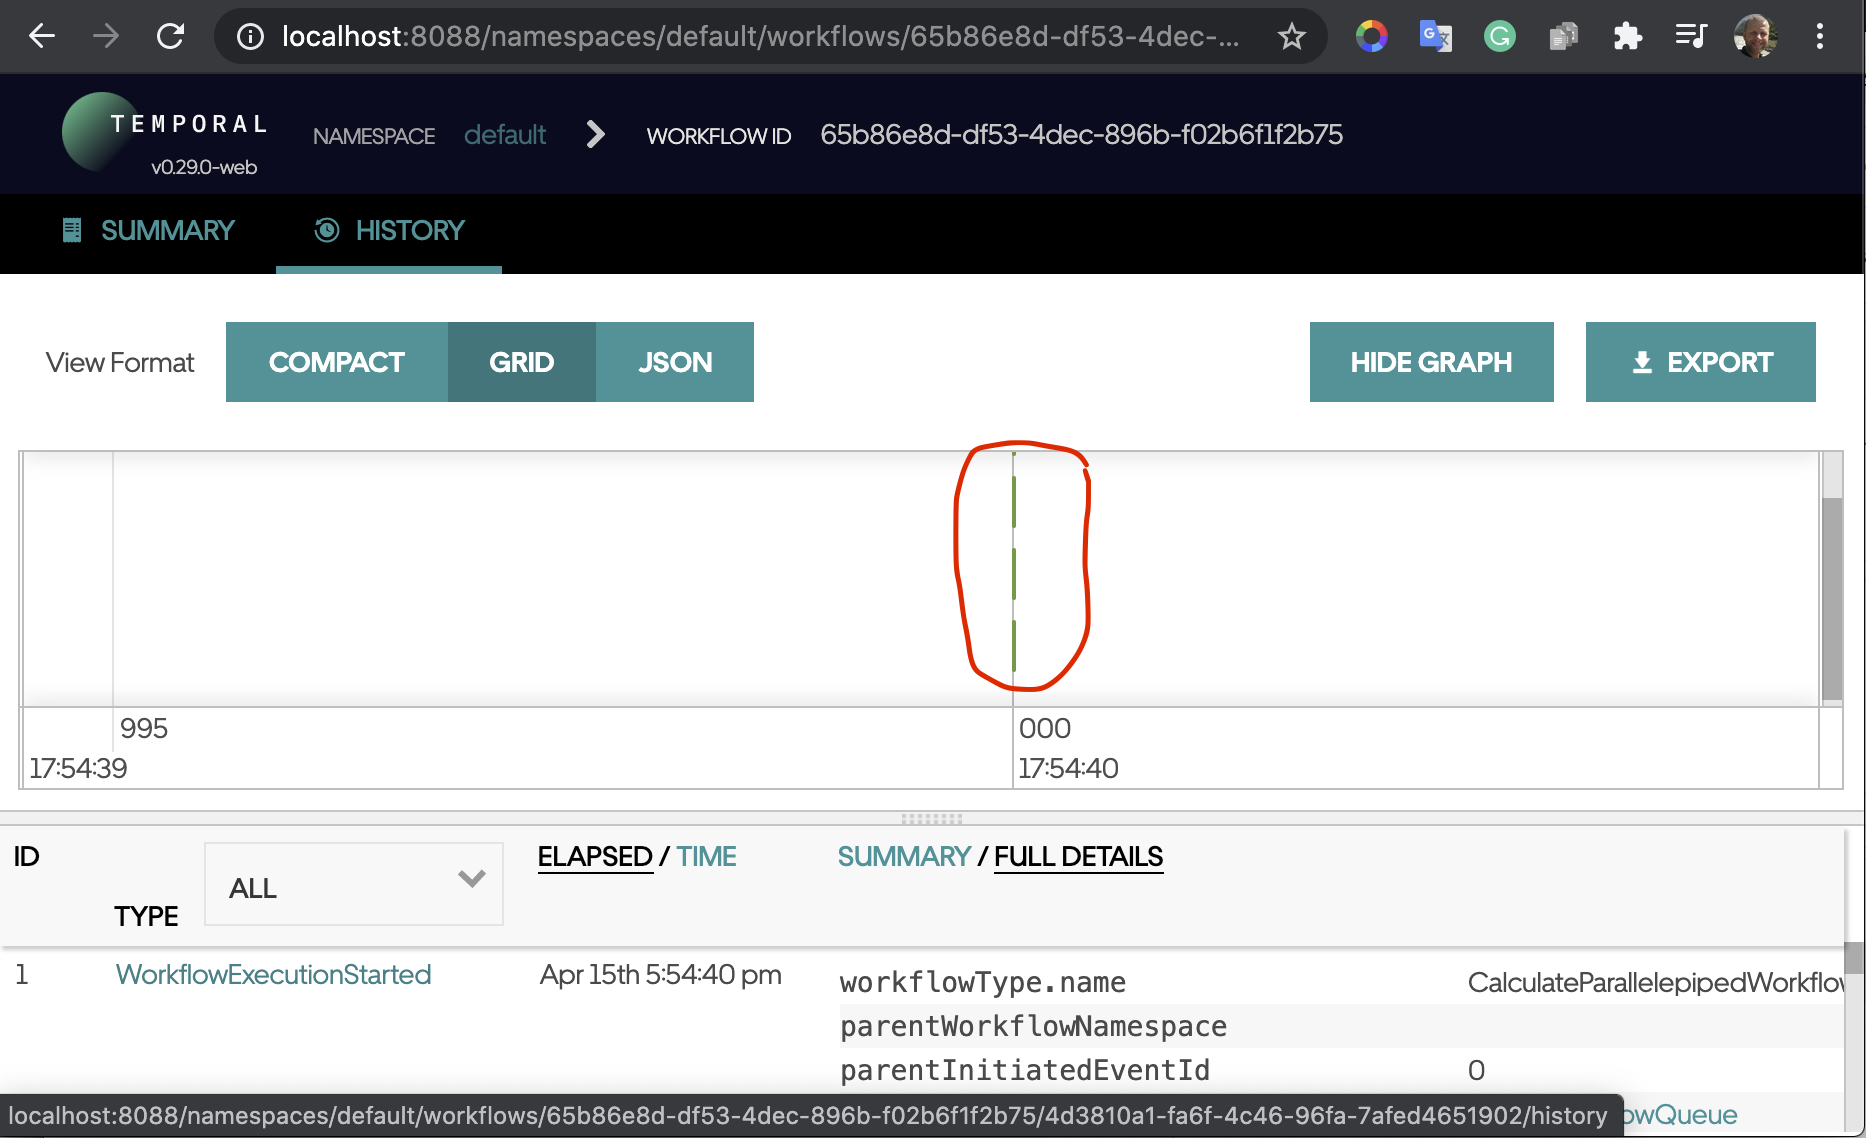
The traces contain the activity spans only. There is no way to have some spans for the details inside the service. And they look not so representative – with no colors and no details. That is OK though because TemporalUI is for exploring the information about the workflows execution, but not for tracing.
Tracing is a separate concern, and it should be implemented using dedicated tools.
There are many commercial tracing platforms or open-source tools on the market nowadays. All of them have advantages and disadvantages and the comparison of the system would require a separate post. Our customer has chosen DataDog as the monitoring system and we will use the DataDog tracing feature to highlight for this post.
DataDog allows for monitoring resources, exploring logs, notifications, building reports, dashboards and many other functions in addition to the tracing. Although DataDog is a commercial product, it provides a two-week trial period. Just go to the site and push the GET STARTED FREE button on the top right. Then follow the registration and login instructions and you will get to the main DataDog dashboard.
Run DataDog Local Agent
Then, you can go to Integrations->Agent and choose Docker agent (as the prerequisite, you will need the Docker to be installed on your computer).
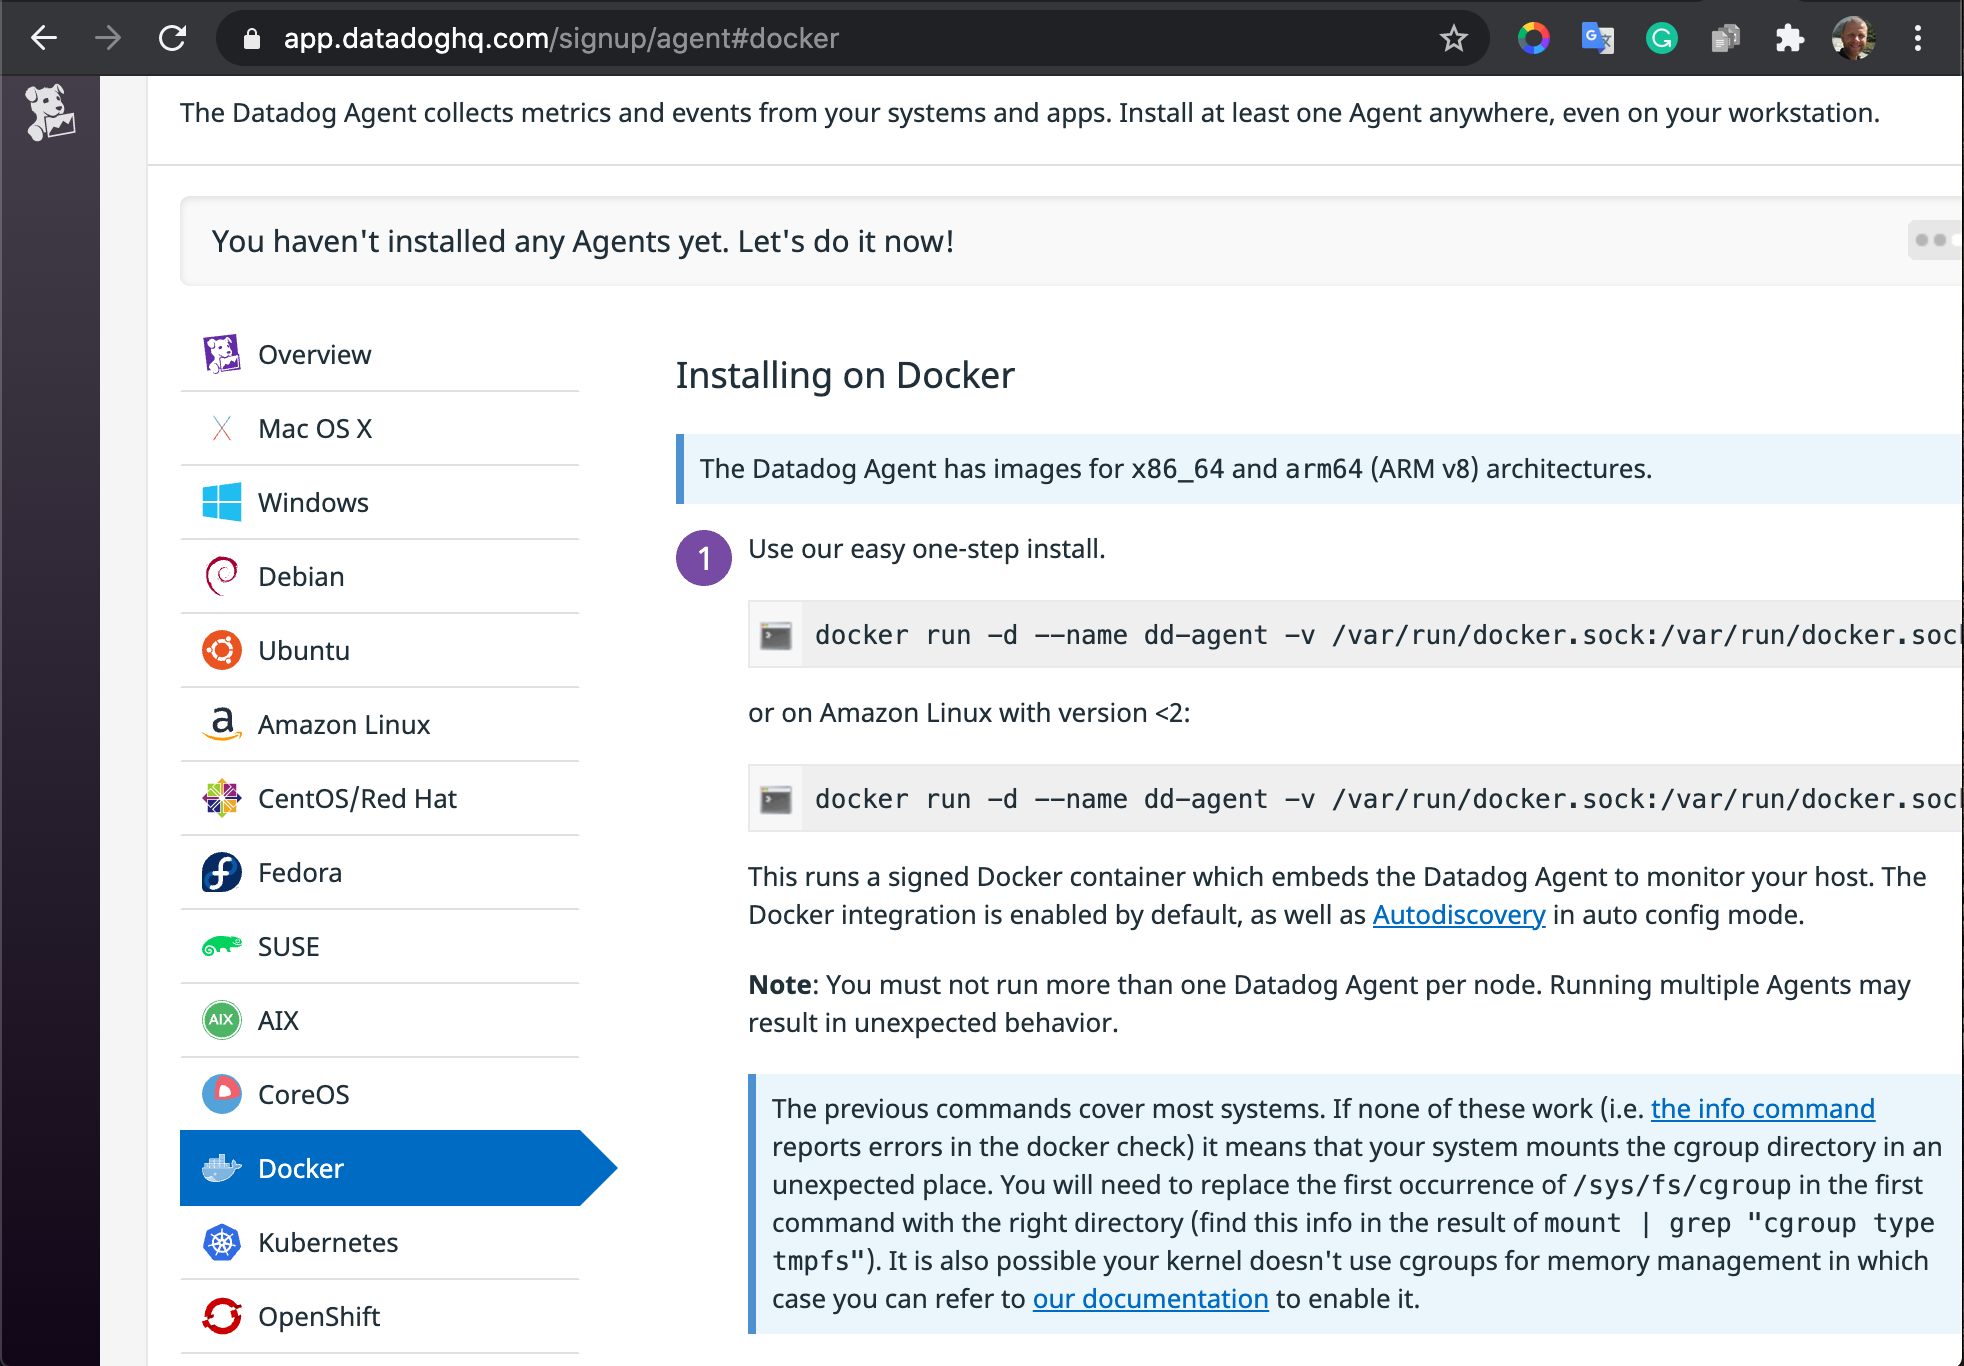
All you need is to run the single command docker container with the DataDog agent from the command line. The command should be copied from the DataDog page. It will contain the application key used for authorization. Please note, you should add -p 8126:8126 to the command in order to allow for mapping the port used by the DataDog client.
Or use the command from the makefile of the sample repository.
So, the agent will be available for the local processes. The localhost address will be available to the DataDog client by default.
Why do we need the DataDog agent? The DataDog tracing feature inside an application pushes the information to the local agent every time it has some new spans. The agent digests the information and sends it regularly to the DataDog cloud server.
Getting traces for a Temporal workflow
As we described in our previous post about Temporal Microservices, Temporal can be used effectively as the microservices orchestration engine and will allow an engineer to construct quite complex behavior workflows with retries, backpressure and fault resistance.
Temporal has its own trace context propagator, but it is implemented for certain headers like opentracing. I am going to let DataDog decide what kind of headers to use. And at the same time, I’ll show what should be done for adding tracing to Temporal. So, I will not use standard Temporal tracing.
For the demo of the things described here, I have created the repository with the branch for traces. All the samples below will be taken from the repository.
What should be added to Temporal for tracing?
Context Propagation
You can read our post on context propagation with Temporal. It will help to understand what context propagation is and why we need context for microservices.
Here, I just will mention that we need to propagate the context to the Temporal headers and do that for normal context and the Workflow Temporal context. This is done in the tracing context propagator.
The WorkflowHeaderWriteAdapter
https://github.com/guntenbein/temporal_microservices/blob/datadog-tracing/context/propagators/datadog_trace.go#L15-L29
is used by the DataDog trace Inject function in order to write any trace data into the workflow headers from the context:
https://github.com/guntenbein/temporal_microservices/blob/datadog-tracing/context/propagators/datadog_trace.go#L65
The WorkflowHeaderReadAdapter
https://github.com/guntenbein/temporal_microservices/blob/datadog-tracing/context/propagators/datadog_trace.go#L31-L51
helps to read the context directly into the DataDog trace by the Extract function:
https://github.com/guntenbein/temporal_microservices/blob/datadog-tracing/context/propagators/datadog_trace.go#L90
There is no information about some specific tracing fields. Thus, DataDog can use any tracing style depending on the account settings
Create Trace with Workflow Context
The ordinary DataDog tracer uses context.Context structure for keeping the traces, but workflows have their own context workflow.Context. And we should allow for creation of the traces inside the workflow. It is done with the StartSpan function from this file.
https://github.com/guntenbein/temporal_microservices/blob/datadog-tracing/context/workflow/tracing.go
Abstractions for Tracer for Service Tracing
It is a bad idea to introduce DataDog tracer into the domain services directly. If you do, it will be difficult to replace DataDog with some other tool. Thus, I have made the abstractions for the tracer and the span and the implementations of the abstractions for DataDog and no-operational implementations that we can use in order to mock the tracing.
Running the example
Requirements needed to run the project:
Start by checking out the project using the following commands:
git clone https://github.com/guntenbein/temporal_microservices.git
Check the branch with the context traces:
git checkout datadog-tracing
Run the DataDog agent as it was described above.
Then, run the Temporal services by typing in the following command from the root of the project:
docker-compose up -d
When the Temporal service starts, run the microservices one-by-one:
go run cmd/microservice_square/main.go
go run cmd/microservice_volume/main.go
go run cmd/microservice_workflow/main.go
Then, run the workflow with the command:
curl --location --request POST 'localhost:8080' \
--header 'process-id: process-number-42' \
--header 'Authorization: *****' \
--header 'Content-Type: application/json' \
--data-raw '{
 "BatchSize": 3,
 "Parallelepipeds": [
   {
     "ID": "5fedcbf7901feb7213e84153",
     "Length": 7584.6668,
     "Width": 8551.7289,
     "Height": 7911.1765
   },
   {
     "ID": "5fedcbf755d18a8e807432d2",
     "Length": 9854.9176,
     "Width": 2333.052,
     "Height": 9977.8465
   },
   {
     "ID": "5fedcbf776f93aa072884a6e",
     "Length": 6186.1635,
     "Width": 7257.3111,
     "Height": 744.9772
   }
 ]
}'
The workflow will run and we will have the results with HTTP response 200. Let us take a look at the traces:
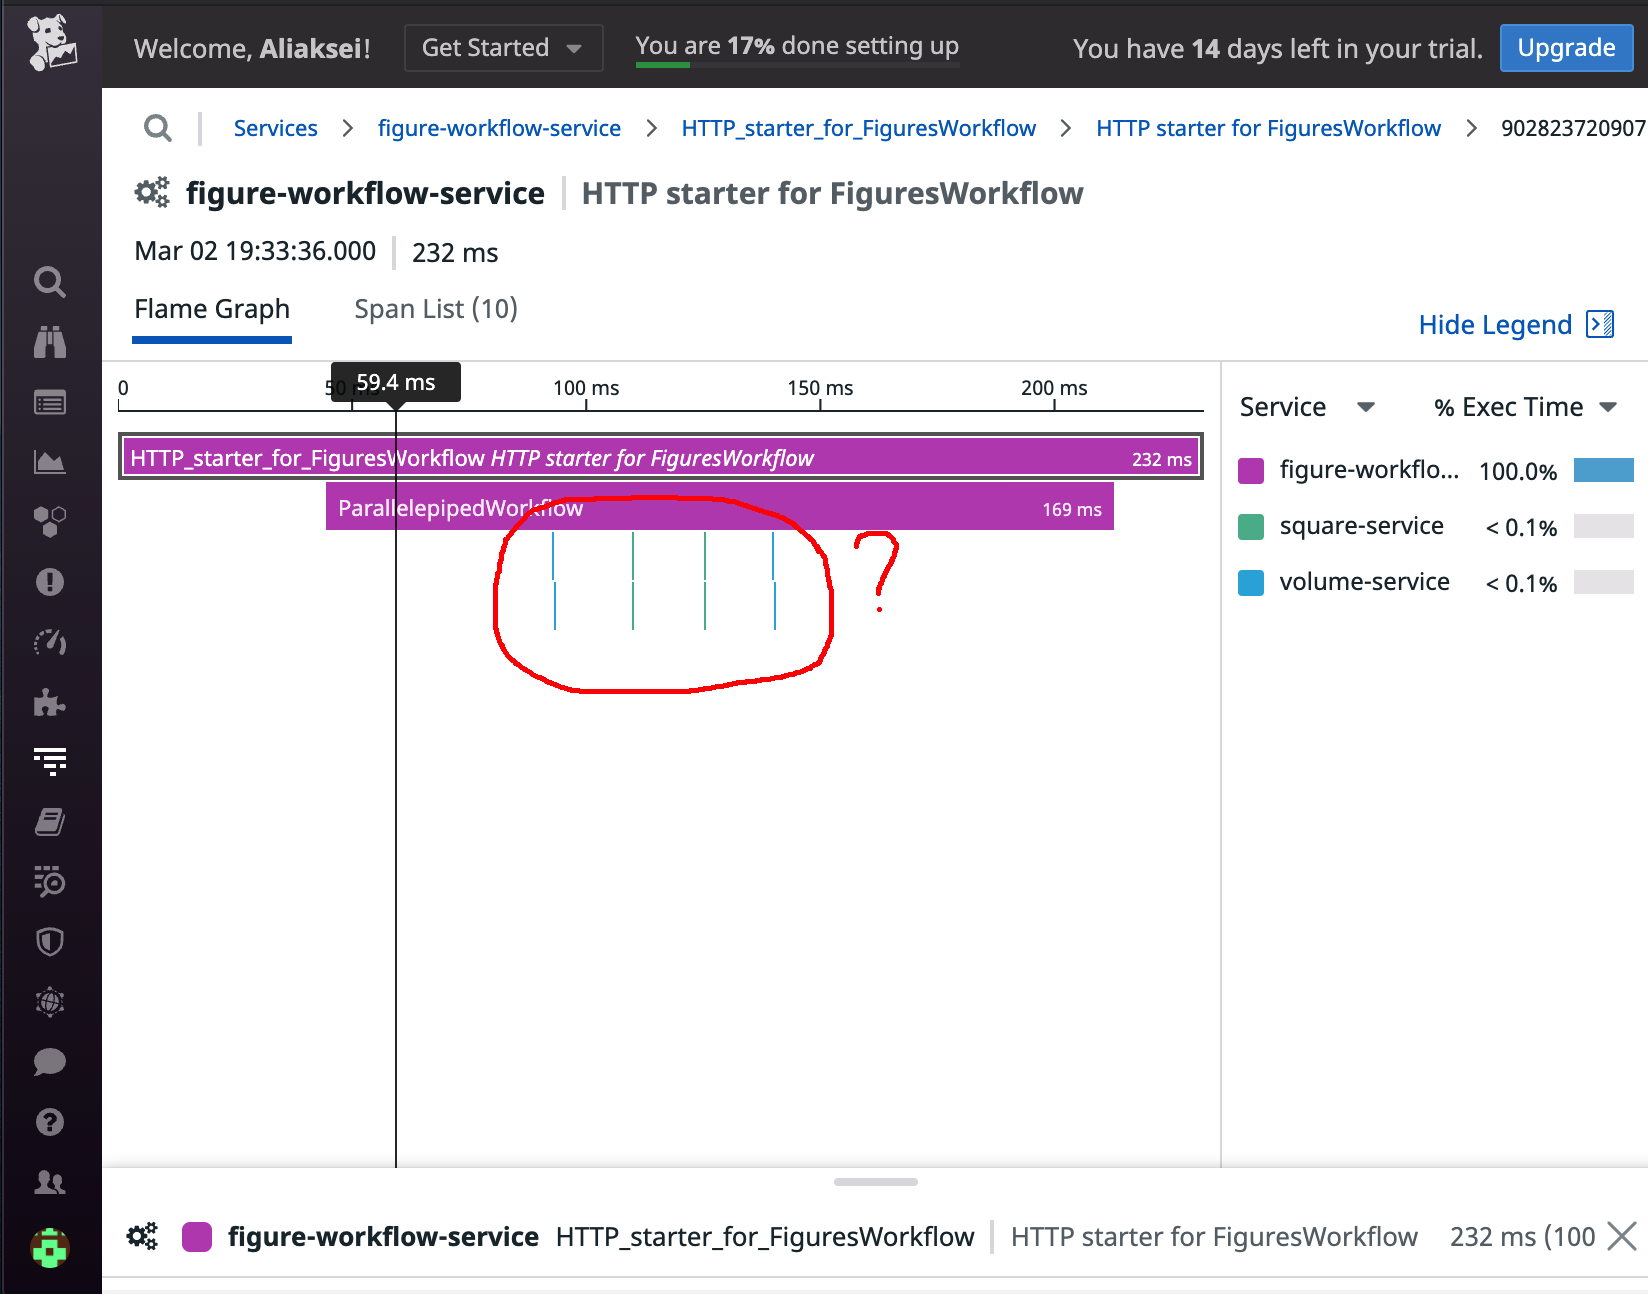
We can see that the Square and Volume activities run in a sequence. But the workflow is arranged in a way to run the activities in parallel. So, what is wrong? The matter is that our activities are too fast and the workflow’s operations take more time than the activities themselves. Let’s put time.Sleep(5\*time.Second) instruction into the service layer, uncommenting the line in Square, and Volume services and restarting them. Then, run the workflow again and we will see the trace where all the activities run in parallel, as expected:
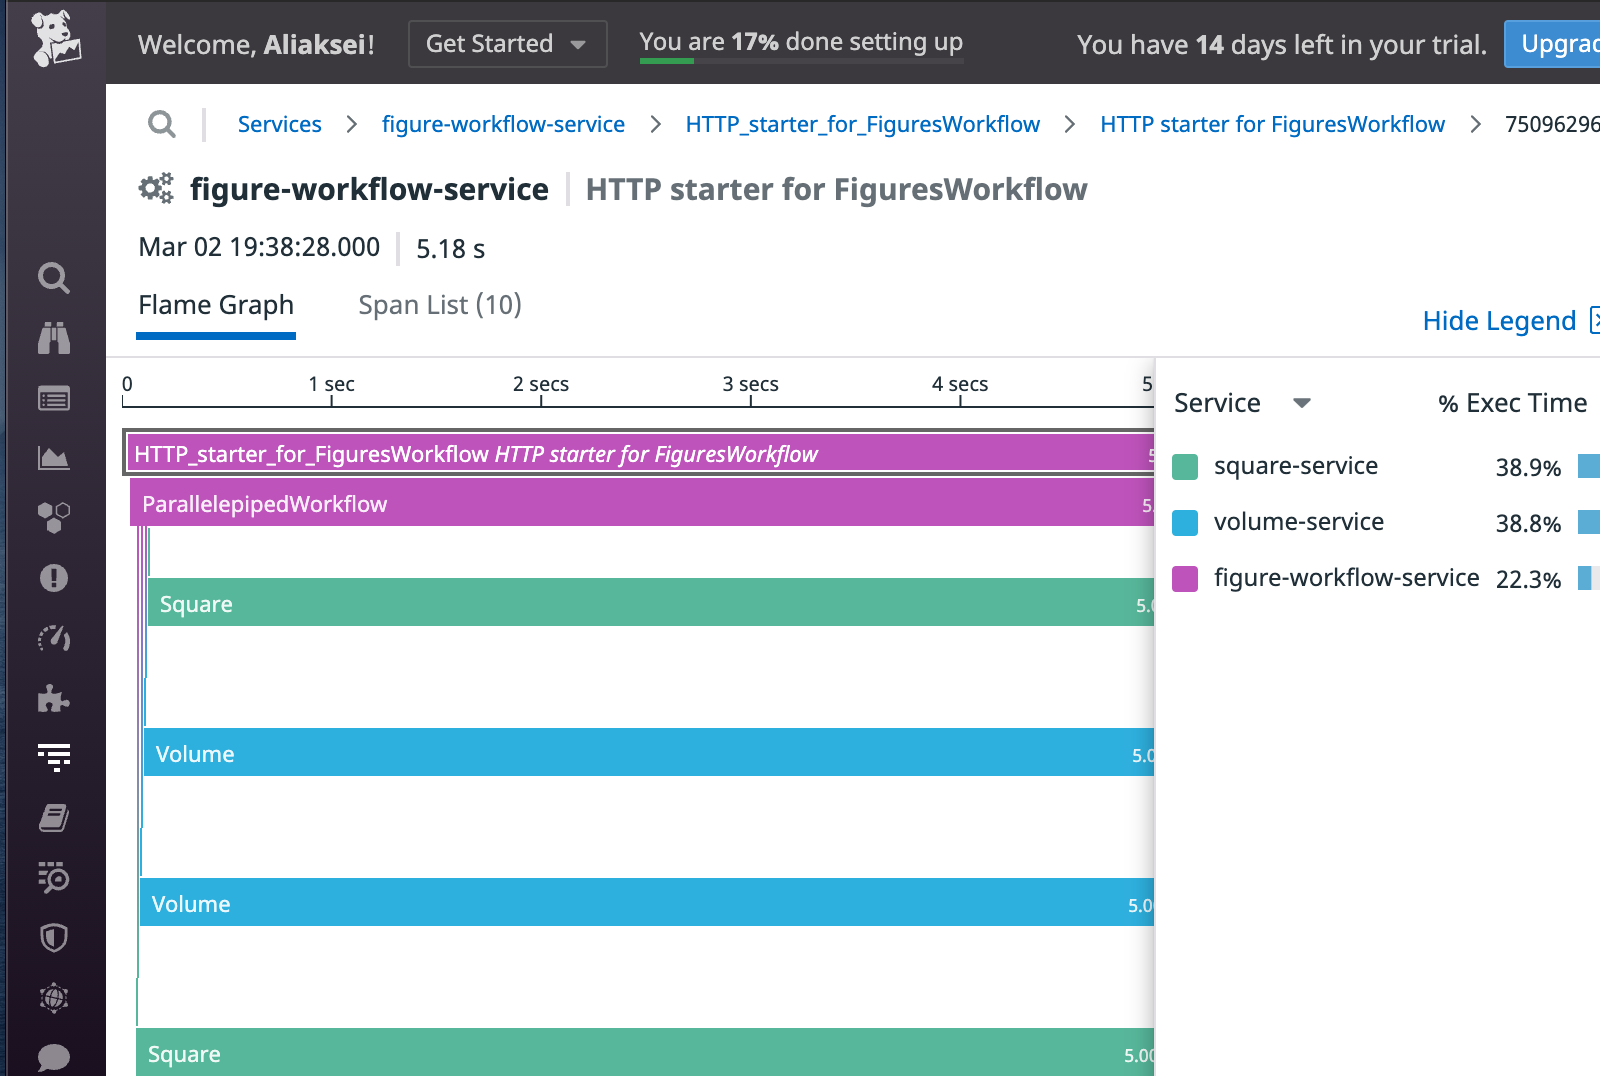
Temporal is used in order to run relatively long processes that take at least seconds. Otherwise, the expenses for the workflow orchestration will take more time than the business logic. All that is possible to observe with the traces.
Conclusions
Tracing is a very important part of the infrastructure for microservices architecture. It should be planned from the very beginning of the system implementation. The workflow orchestration engine should support tracing and Temporal does this work quite well. If you want to add the tracing part to Temporal, you should use the native Temporal tracing or write your own context propagator and span creation function. This will give you more control and understanding of how this works.
DataDog is a convenient metrics and reporting service and tracing is only a small part of a big list of nice features that DataDog has. The only disadvantage is that it is not free.